반응형
mabplotlib 에서 화면을 분할하여 그래프를 그래는 메소드는 여러가지가 있습니다. 그 중 subplots 메소드로 그리는 방법을 알아봅시다. subplots 메소드를 사용하려면 두가지를 알아야 합니다.
- Figure
- subplot
figure 는 그래프가 그려지는 화면입니다. subplot 은 그래프입니다. 한 figure 안에 여러개의 그래프를 그릴 수 있습니다.
그래프는 보통 ax 라고 이름붙입니다. figure 하나를 만들고 그래프 네개를 그려보겠습니다.
먼저 matplotlib 를 불러옵시다.
import matplotlib.pyplot as plt
subplots 메소드를 실행해봅시다. 2,2 는 화면을 2행2열로 분할하겠다는 의미입니다.
plt.subplots(2,2)

>>> plt.subplots(2,2)
(<Figure size 640x480 with 4 Axes>, array([[<AxesSubplot:>, <AxesSubplot:>],
       [<AxesSubplot:>, <AxesSubplot:>]], dtype=object))
Figure 와, 4r개의 ax 가 있는 것을 알 수 있습니다. 아래와 같이 변수를 지정하면 Figure와 ax를 변수를 이용하여 접근할 수 있게됩니다.
fig,ax=plt.subplots(2,2)

>>> fig
<Figure size 640x480 with 4 Axes>
>>> ax
array([[<AxesSubplot:>, <AxesSubplot:>],
       [<AxesSubplot:>, <AxesSubplot:>]], dtype=object)
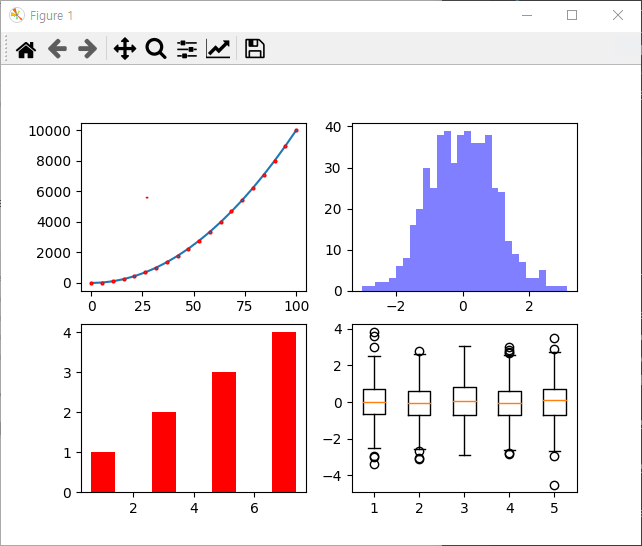
각 ax에 그래프를 그려봅시다.
#그래프 그리기
ax[0,0].plot(np.linspace(0,100,20),np.linspace(0,100,20)**2, marker='o', markersize=2, markeredgecolor='r')
ax[0,1].hist(np.random.randn(500), bins=30, color='b', alpha=0.5)
ax[1,0].bar([1,3,5,7],np.array([1,2,3,4]),color='r')
ax[1,1].boxplot(np.random.randn(500,5))

plt.show()
이번에는 제목과 축이름을 추가해봅시다. 첫번째 그래프에만 추가하겠습니다. 나머지 그래프에도 적용 원리는 동일합니다. 공간이 필요하므로 subplots_adjust 메소드로 세로와 가로 간격을 확보합니다.
#그래프 사이 간격 추가
fig.subplots_adjust(hspace=0.5,wspace=0.3)

#제목, x축,y축 이름 추가
ax[0,0].set_xlabel('X') #x 라벨
ax[0,0].set_ylabel('Y') #y 라벨
ax[0,0].set_title("Graph1") #그래프 이름
아래는 결과입니다.

아래는 전체 코드입니다.
import matplotlib.pyplot as plt
import numpy as np

#figure,ax 만들기
fig,ax=plt.subplots(2,2)

#그래프 그리기
ax[0,0].plot(np.linspace(0,100,20),np.linspace(0,100,20)**2, marker='o', markersize=2, markeredgecolor='r')
ax[0,1].hist(np.random.randn(500), bins=30, color='b', alpha=0.5)
ax[1,0].bar([1,3,5,7],np.array([1,2,3,4]),color='r')
ax[1,1].boxplot(np.random.randn(500,5))

#그래프 사이 간격 추가
fig.subplots_adjust(hspace=0.5,wspace=0.3)

#제목, x축,y축 이름 추가
ax[0,0].set_xlabel('X') #x 라벨
ax[0,0].set_ylabel('Y') #y 라벨
ax[0,0].set_title("Graph1") #그래프 이름

plt.show()
반응형
'Matplotlib > subplot 구조 이해' 카테고리의 다른 글
| 파이썬 한 화면에 여러 그래프 그리기 (add_subplot) (0) | 2022.03.14 |
|---|

댓글